I know that I've talked extensively about the fall in Greek savings rate witnessed after the onset of the new millenium and EMU accesion but I want to add some further thoughts on that.
I personally despise cliches but some times there is some truth in them or, if you prefer, as the Greek proverb claims "where there's smoke there's fire too".
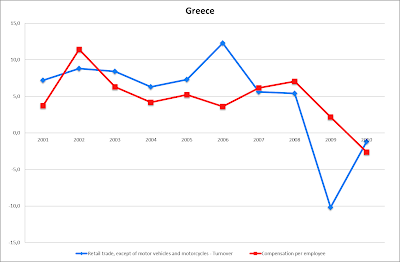
Another reason due to which gross savings plummeted, that I didn't really touch on in the two previous occasions that I wrote about this (here and here), was an increase in private consumption. Take a look at the following chart.
 | |
| source: Eurostat, ECB |
As you can see, during the 2003-2007 time interval, retail sales growth outpaced wage growth, which can only mean that people either saved less or financed their additional consumption through taking on more debt, or both. This was what actually took place in Greece. Here's the evolution of gross savings rate.
 |
| source: IMF |
As you can see after 2003 the gross savings rate plummeted. At the same time households satrted taking on more debt. Part of that debt was used to finance house acquisitions but another part was maybe used to support consumption (unfortunately I don't have any data about that, so this is conjecture). According to IMF, in Q1 2011, residential real estate loans accounted for 21,9% of total loans exteded by the Greek banking sector. Admittedly, Greek households are among the least indebted in the EU, nonetheless their indebtness increased exponentially during this period. This is what matters really, since in order to service debt, households have to equally decrease their spending and saving. Here's the chart.
 |
| source: Eurostat |
But what brought on this change in the consumption behaviour of Greek households ? After Greece became part of the Eurozone, Greek people for the first time experienced living with a "hard" currency, something that made imports cheaper and spurred their spending. Imports balloned after Greece became part of the EMU.
 |
| source: AMECO |
And if you want a more detailed breakdown of the categories of expenditured towards whom additional households' consumption was channelled take a look at the following chart.
 |
| source: Eurostat |
I plotted Harmonised Index of Consumer Prices (HICP) item weights for certain categories of households' expenditures that rose in importance during the period pictured. When the weight of a certain category of expenditure rises this means that it accounts for an increased chunk of total household spending.
No comments:
Post a Comment